Sequence Diagram
A sequence diagram is a type of interaction diagram in Unified Modeling Language (UML) that illustrates how objects interact in a particular scenario over time. It focuses on the order of messages exchanged between objects, helping to visualize the flow of control and data in a system.
Sequence Diagram
Key Components of Sequence Diagrams
-
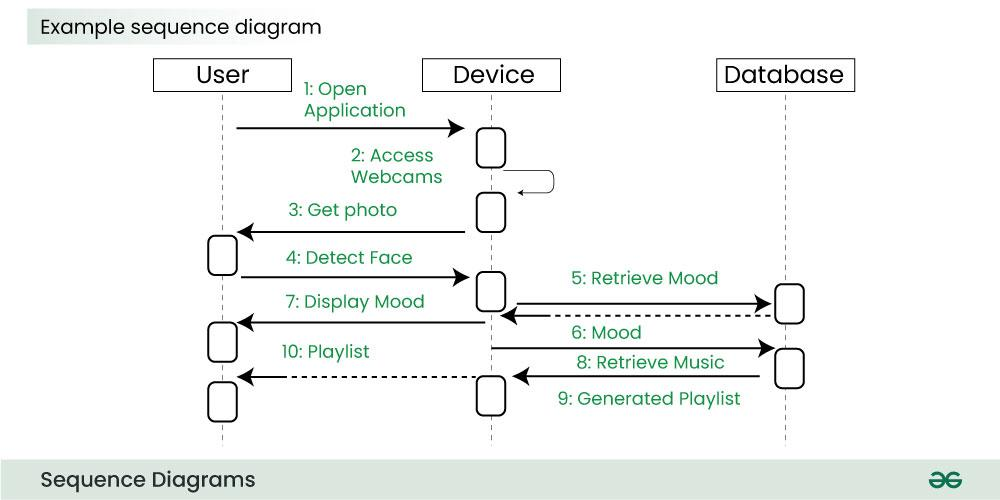
Lifelines
- Represent the different participants in the interaction, which can be objects or actors.
- Each lifeline is depicted as a vertical dashed line that extends downward from the participant.
-
Messages
- Arrows between lifelines represent messages sent from one participant to another.
- Each message arrow is labeled with the message name, and can also include parameters.
- The direction of the arrow indicates the flow of the message.
-
Activation Boxes
- Rectangles on a lifeline that indicate the period during which an object is active or controlling the flow of messages.
- The length of the activation box represents how long the object is active.
-
Return Messages
- Dashed arrows that indicate the return of control from one object to another.
- These are typically labeled with the return value, if applicable.
-
Conditions and Loops
- Conditional and loop constructs can be represented using frames, indicating when certain messages are sent based on specific conditions or when messages are repeated.
Syntax of Sequence Diagrams
- Lifelines: Represented as a vertical dashed line with the participant’s name at the top.
- Messages: Represented as arrows pointing from one lifeline to another, with optional parameters in parentheses.
- Activation: Represented as a rectangle on the lifeline during which the participant is active.
- Return Messages: Represented as a dashed arrow pointing back to the sender.
Purpose and Usage
- Modeling Use Cases: Sequence diagrams help model the interactions defined in use cases, providing a detailed view of how objects collaborate to fulfill specific functionality.
- Visualizing Processes: They are useful for visualizing complex processes, especially in real-time systems or scenarios involving multiple interacting objects.
- Analyzing Behavior: Sequence diagrams allow analysts and developers to analyze the behavior of a system, ensuring that all necessary interactions are accounted for.
Benefits of Sequence Diagrams
- Clarity: Provide a clear visual representation of object interactions and message flows, aiding understanding for both technical and non-technical stakeholders.
- Documentation: Serve as effective documentation tools during system design and implementation, helping to convey system behavior to team members.
- Error Identification: Facilitate the identification of potential errors or misunderstandings in system interactions early in the development process.