Fishbone (Ishikawa) Diagram in Information Systems
Introduction
In the context of Information Systems (IS), the Fishbone Diagram (also known as the Ishikawa Diagram or Cause-and-Effect Diagram) is used to identify and analyze potential causes of problems within an IT system or project. This tool helps teams uncover the root causes of system failures, performance issues, or other IT-related challenges.
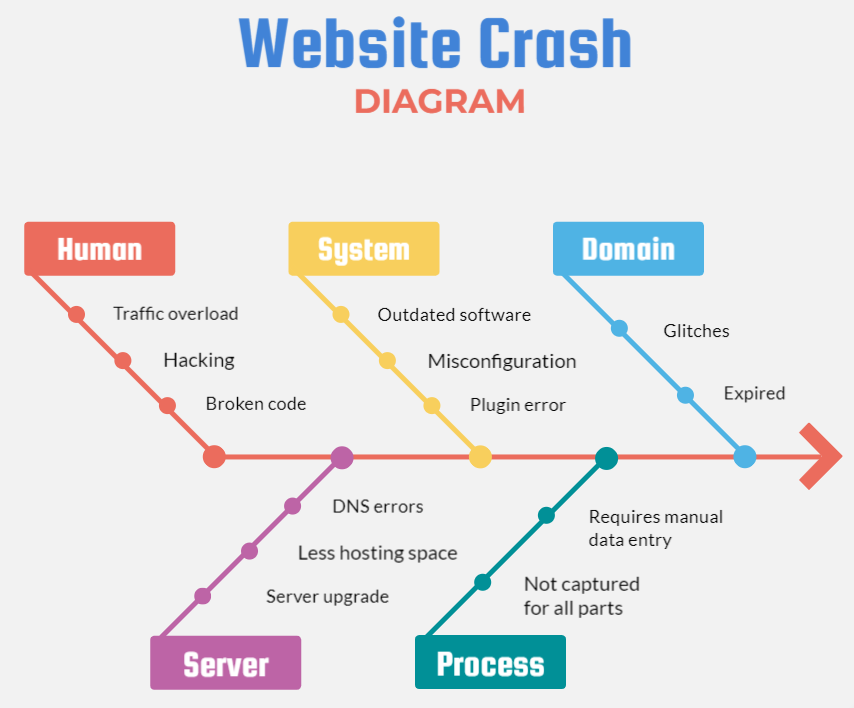
Example Fishbone diagram
Structure
The diagram remains in its typical fishbone shape, where the main problem (such as system downtime or data inconsistency) is at the head, and potential causes are grouped into categories branching off the spine.
Purpose in Information Systems
- To identify root causes of issues in IT systems, such as system crashes, performance bottlenecks, or security breaches.
- To visualize and organize possible causes, helping teams to break down complex IS issues.
- To support problem-solving efforts by identifying and focusing on actionable causes.
Common IS Categories
- People: User errors, lack of training, miscommunication among IT staff, or inadequate support.
- Processes: Flawed workflows, outdated procedures, or inefficient business processes.
- Technology: Software bugs, hardware malfunctions, integration issues, or outdated systems.
- Data: Inaccurate data, poor data quality, or data duplication.
- Network/Infrastructure: Network outages, bandwidth issues, or configuration errors.
- External Factors: Vendor issues, third-party services, or compliance with external regulations.
Process
- Identify the Problem: Start by defining the IS issue clearly, such as “System Downtime” or “Slow Response Time.”
- Brainstorm Causes: Identify major categories relevant to IS (People, Processes, Technology, etc.).
- Add Sub-Causes: For each category, identify specific causes (e.g., outdated software, untrained users, poor data migration).
- Analyze the Diagram: Look for patterns or frequent issues that could be the root causes. Prioritize causes for further investigation or fixes.
Example in IS
If the problem is slow system performance, possible branches could include:
- People: Insufficient user training, excessive user load.
- Processes: Inefficient data querying, complex workflows.
- Technology: Outdated hardware, incompatible software updates.
- Data: Redundant or missing data, large data volumes.
- Network/Infrastructure: Limited bandwidth, poor server configuration.
- External Factors: Vendor delays in patch updates, external security threats.
Benefits in Information Systems
- Systematic exploration of issues, providing a visual method to identify potential causes.
- Encourages collaboration between IT staff, business users, and other stakeholders.
- Helps in prioritizing root causes for effective problem resolution.
- Organizes complex IS problems, making them easier to understand and address.
Limitations in IS
- May oversimplify multifaceted technical issues if not enough detail is provided.
- Requires good data and thorough brainstorming for accurate identification of root causes.
- Not always effective for complex, dynamic systems where issues are interconnected.
The Fishbone Diagram is a valuable tool in Information Systems to diagnose issues systematically and drive efficient problem-solving across IT teams and business units.