Gantt Chart
A Gantt Chart is a visual tool used in project management to illustrate the timeline of a project. It helps in tracking project progress, scheduling tasks, and managing resources effectively.
Key Features
- Horizontal Bars: Represent tasks or activities. The length of each bar indicates the duration of the task.
- Timeline: Shown on the horizontal axis, it represents the project’s timeframe, often broken down into days, weeks, or months.
- Task Dependencies: Visualizes relationships between tasks, showing which tasks need to be completed before others can start.
- Milestones: Important checkpoints or goals in the project are marked to track progress.
Components
- Tasks: Listed on the vertical axis. Each task is represented by a horizontal bar spanning its start and end dates.
- Timeline: Shows the project’s schedule along the top of the chart.
- Dependencies: Arrows or lines between tasks indicate dependencies or relationships.
- Milestones: Key events or deadlines are marked to track significant points in the project.
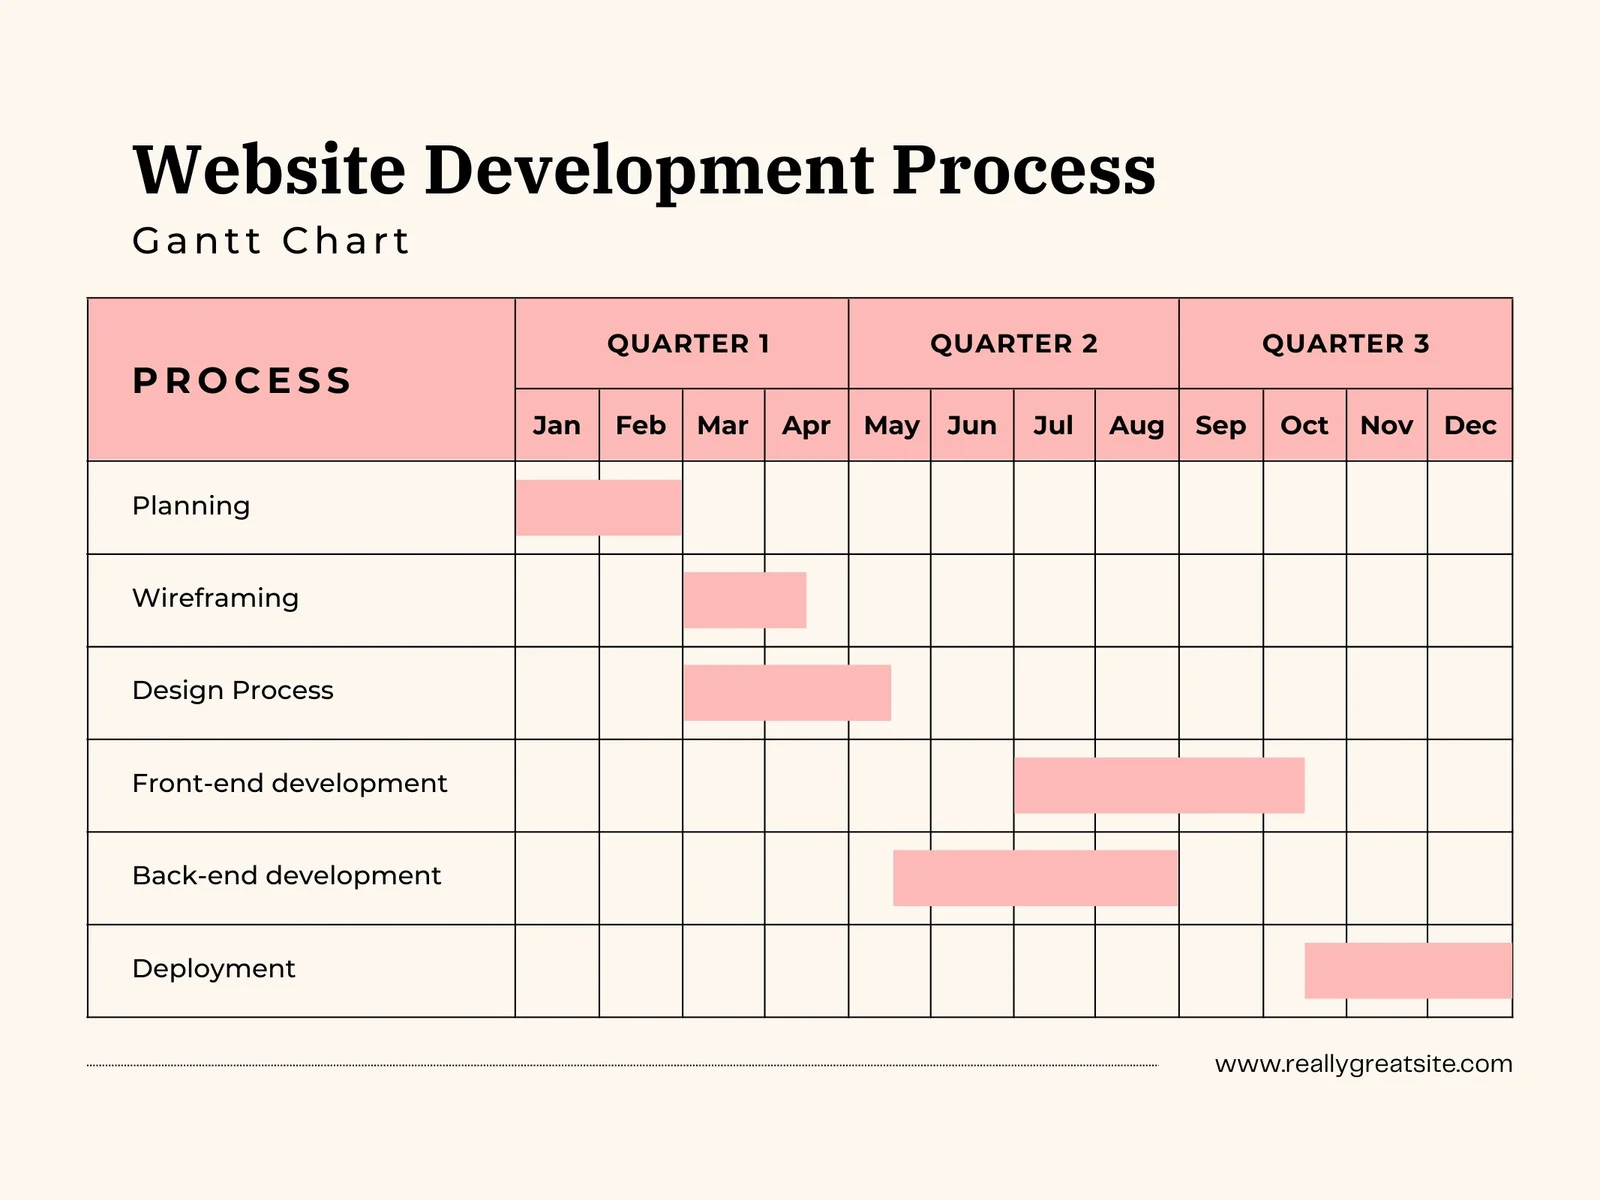
Example Gantt Chart
Gantt Chart
Benefits
- Clear Visualization: Provides an easy-to-understand view of the project’s schedule and task durations.
- Progress Tracking: Allows for monitoring the completion status of tasks.
- Resource Management: Helps in allocating resources efficiently and avoiding conflicts.
- Coordination: Facilitates communication and coordination among team members by showing task sequences and dependencies.
Tools
Gantt charts can be created using various software tools, including:
- Microsoft Project
- Excel
- Asana
- Jira
- Trello
- Smartsheet
Gantt charts are valuable for managing and planning projects, ensuring that all tasks are completed on time and within scope.