PERT Chart
A PERT (Program Evaluation and Review Technique) Chart is a project management tool used to communicate task dependencies and visualize the sequence of tasks within a project. It helps in identifying the critical path and managing project schedules effectively.
Key Features
- Task Dependencies: Illustrates the relationships and dependencies between tasks, showing which tasks need to be completed before others can start.
- Critical Path: Identifies the longest path through the project, which determines the shortest time to complete the project. Delays on this path directly impact the project’s overall duration.
- Event Nodes: Represent milestones or significant points in the project timeline. These nodes are connected by arrows that depict task sequences.
Components
- Events (Nodes): Points that signify the start or completion of a task. They are usually represented by circles or rectangles.
- Tasks (Arrows): Represent the work required to move from one event to the next. The length of the arrow can indicate the duration of the task.
- Dependencies: Arrows between events show the dependencies and sequence of tasks.
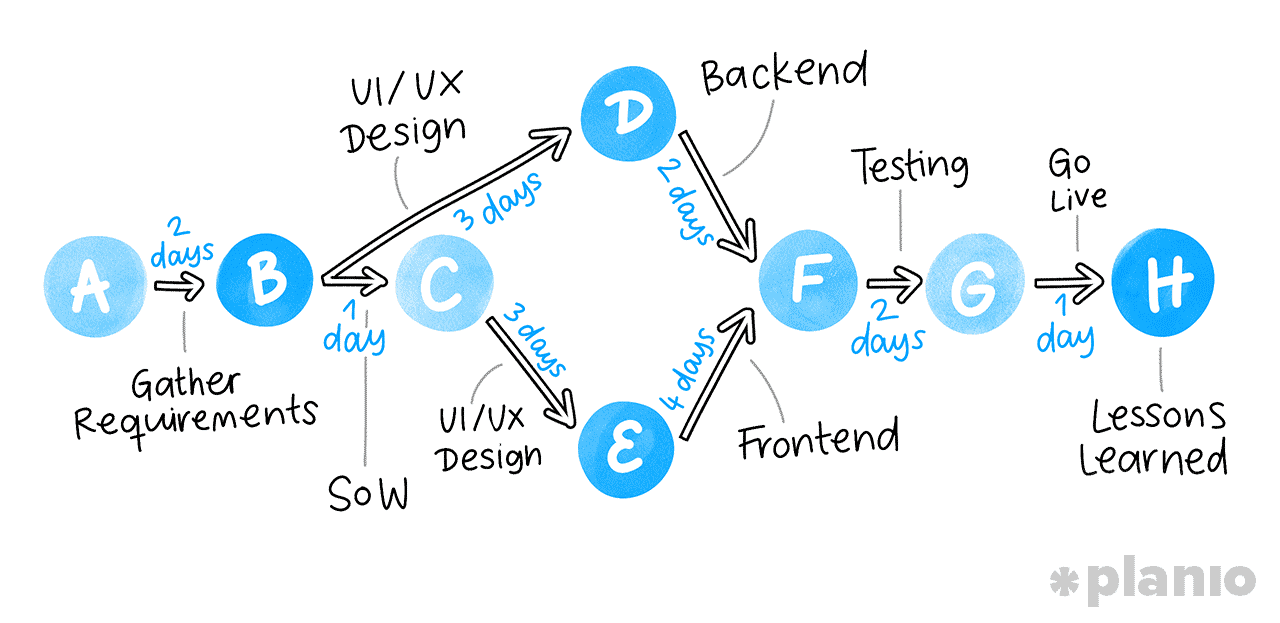
Example PERT Chart
PERT Chart
Benefits
- Visualizing Task Dependencies: Makes it easier to understand how tasks are related and the sequence in which they need to be completed.
- Identifying Critical Path: Helps in pinpointing the most crucial tasks that directly affect the project’s duration.
- Improving Project Scheduling: Facilitates better planning by highlighting potential delays and scheduling conflicts.
- Enhancing Communication: Provides a clear visual representation of the project’s timeline and task dependencies for stakeholders.
Tools
PERT charts can be created using various software tools, including:
- Microsoft Project
- Lucidchart
- SmartDraw
- ProjectLibre
PERT charts are essential for managing complex projects, helping to ensure that all tasks are completed efficiently and that the project remains on schedule.